Ever wonder why infographics and data visualization have become so popular over the last year or two? Here is a quick overview of a few of the reasons why visualization is important, highlighted with an infographic by J6Design.
Short Attention Spans
With the constant hustle and bussle of modern life, people have short attention spans. This is demonstrated by the fact that most people will decide to leave a website or continue exploring it in the first 2-4 seconds of seeing the page. With very little time to convince people to stick around, infographics and visualizations are a more effective way to literally catch peoples’ eye.
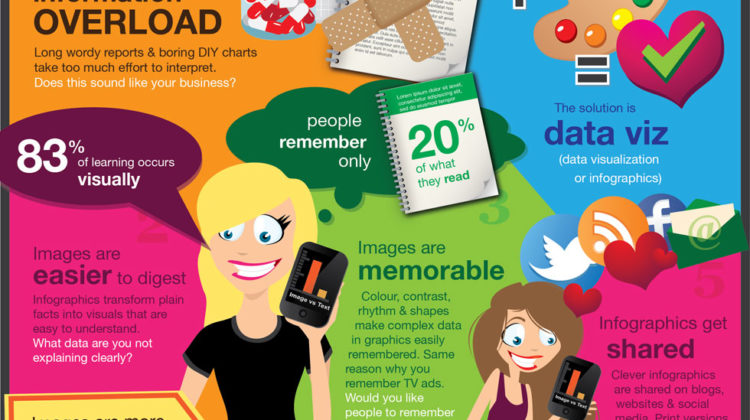
Information Overload
With the world’s information currently doubling every two years, it is no wonder people experience information overload. With smartphones, tablets and the ubiquity of the internet, people are constantly receiving, analyzing, sharing and creating new information. Due to this overload you need to stick out to get people’s attention. Creating a compelling visualization of data or information can make it really stick out from all of the other noise of day-to-day life.
Easy to Understand
As humans, we are very visual creatures. Our ability to quickly interpret visual information is far greater than that of written words. By creating visualizations you can make complex information easier to understand.
Reading Retention
People have horrible retention rates for the information they read. According to the data sited in the infographic on data visualization below, people only remember about 2% of what they read.
More Engaging
With such a large volume of new content published every day, people are inundated. By creating something that is visually compelling, people are more likely to be engaged.
People Love Sharing Infographics
The visual nature of the human species is highlighted by just how much people love sharing infographics and interesting data visualizations. This is demonstrated by the widespread adoption of infographics for link building and viral marketing. If people have a choice between something that is visually compelling and easy to digest they are going to choose that over other forms such as written word that takes longer and more energy to digest.
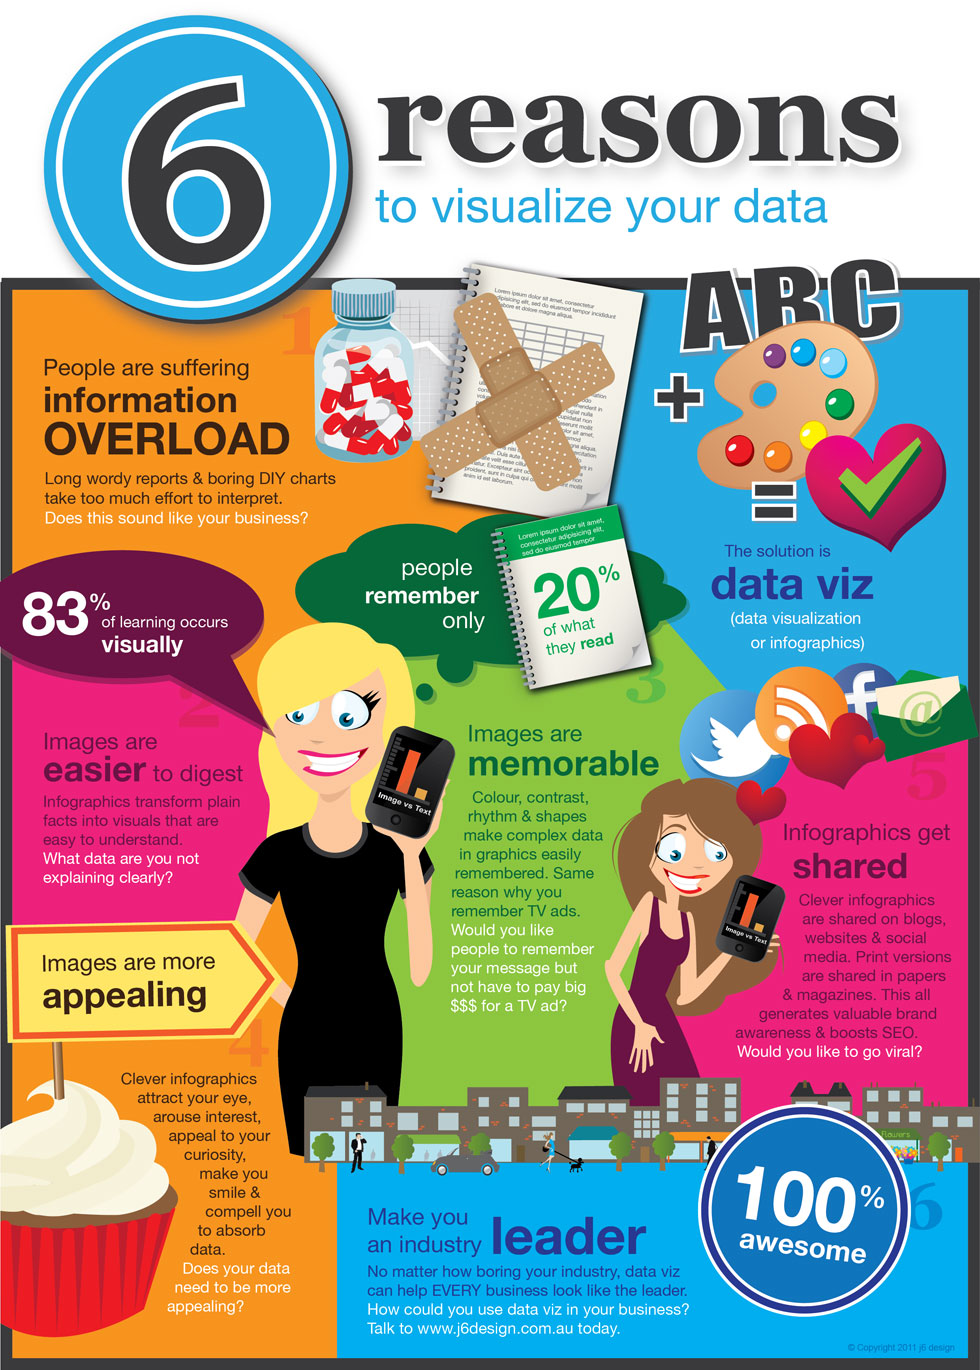
Infographic courtesy of J6Design.