Wondering if you should be using Adwords or Facebook ads for your business? Here is a quick breakdown of the benefits of the two advertising platforms and a collection of important statistics from 212. Here are the real interesting facts for advertisers:
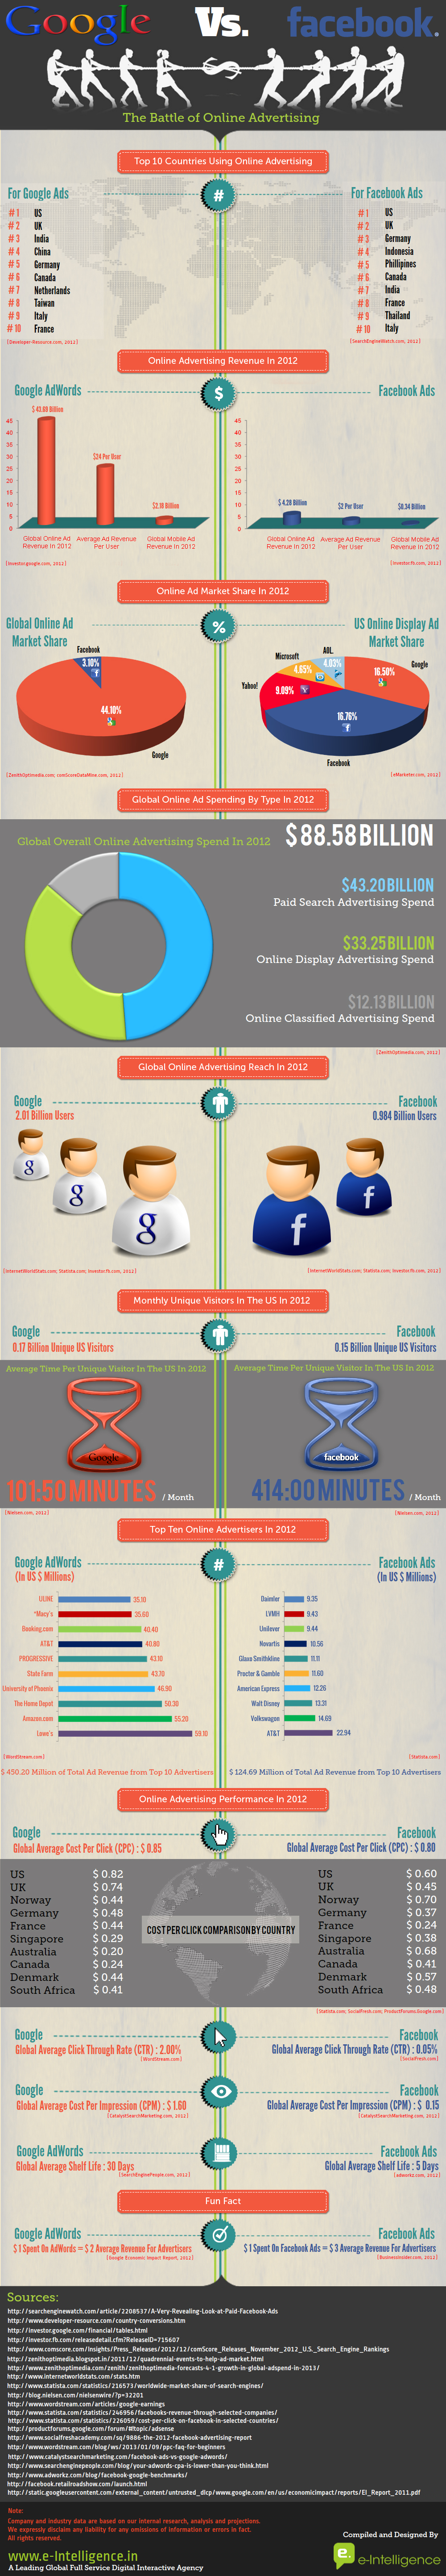
Click-Through Rate – Google 2.% vs Facebook .5%
Average CPM – Google $1.6 vs Facebook $.15
Revenue Per $1 on Advertising – Google $2. vs Facebook $3.
Now on to the statistics on Adwords and Facebook advertising….
When you compare the amount of ad revenue generated by the two ad platforms Adwords earned a whopping $43.69 billion while Facebook only brought in $4.28 billion. That works out to $24 per user for Adwords and only $2 per user for Facebook. However, when looking at mobile ad revenue Adwords only made $2.18 billion compared to Facebook’s $.34 billion in 212.
With the majority of the $88.58 billion in advertising revenue from 212 coming from paid search, $43.2 billion to be exact, it is no wonder that Adwords near monopoly on search advertising delivers such a huge amount of revenue for Google’s Adwords. When combined with the display advertising offering provided by Adwords Display Network it is no wonder that the amount of revenue earned from the top 1 advertisers on Adwords is significantly greater than Facebook. In total, Adwords earned $45.2 million while Facebook only earned $124.69 million from their top 1 advertisers.
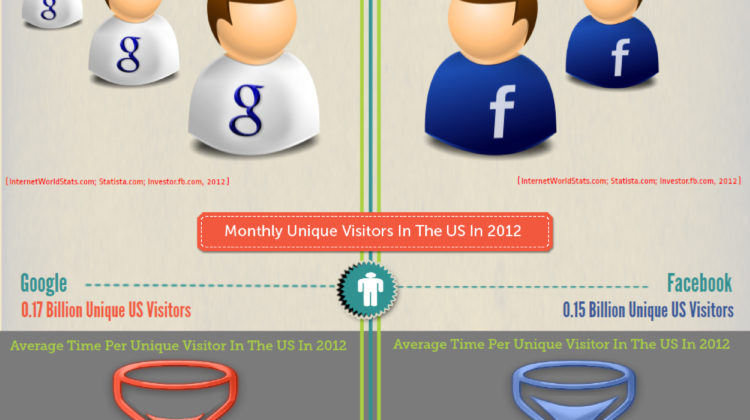
It gets really interesting when you look at ad market share in the US. Globally Adwords dominates Facebook with a 44% market share compared to Facebook’s 3.1%. However, if you just look at the US, Google’s display ad market share is actually smaller with only 16.5% compared to Facebook’s 16.75%. With the average Google user spending 11:5 minutes per month vs Facebook’s 414: minutes per month it is not surprising that Facebook beats out Google in the US despite having almost 1 billion fewer monthly users.
As the role of mobile, search and Facebook’s platform continues to evolve it will be interesting to see what ad platform provides the best bang for the buck for advertisers and brings home the big ad revenue over the next 3-5 years.
Infographic courtesy of E-Intelligence.