• Skip to main content
  • Skip to primary sidebar
  • Skip to footer
  • Home
  • How To
  • Infographics
  • News
  • Platforms
  • Interviews
  • Lifestyle
  • Analysis
Social Media Chimps

Social Media Chimps

Everything Social Media Marketing

You are here: Home / Infographics / The Science Behind Timing Your Blog Posts — Infographic

The Science Behind Timing Your Blog Posts — Infographic

by Matt Fields

The Science Behind Timing Your Blog Posts Infographic

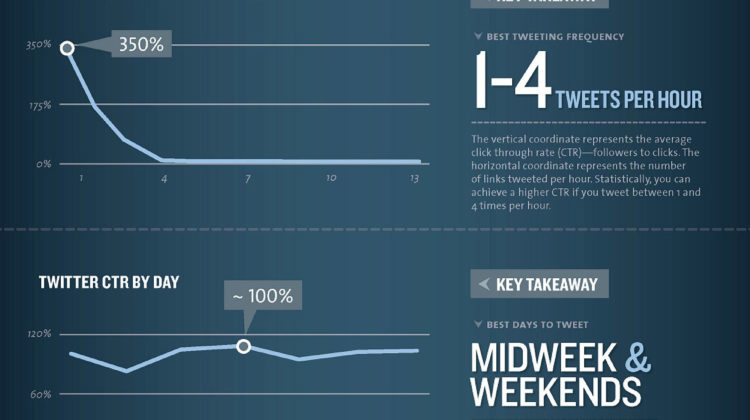
Web traffic fluctuates throughout the day. In this infographic, you’ll learn the most optimal time for you to publish your new posts or articles in order to maximize exposure. You’ll also learn how blog traffic changes throughout the week, and what days and times are best for publishing new posts.

Keep in mind that this infographic presents averages, and that each market and niche is different. By monitoring your blog’s analytics, you should be able to determine the busiest times and adjust your blogging strategy accordingly.

How do you try to time your blog posts and tweets? Do you target peak times, or do you try to avoid the noise?

The Science Behind Timing Your Blog Posts Infographic

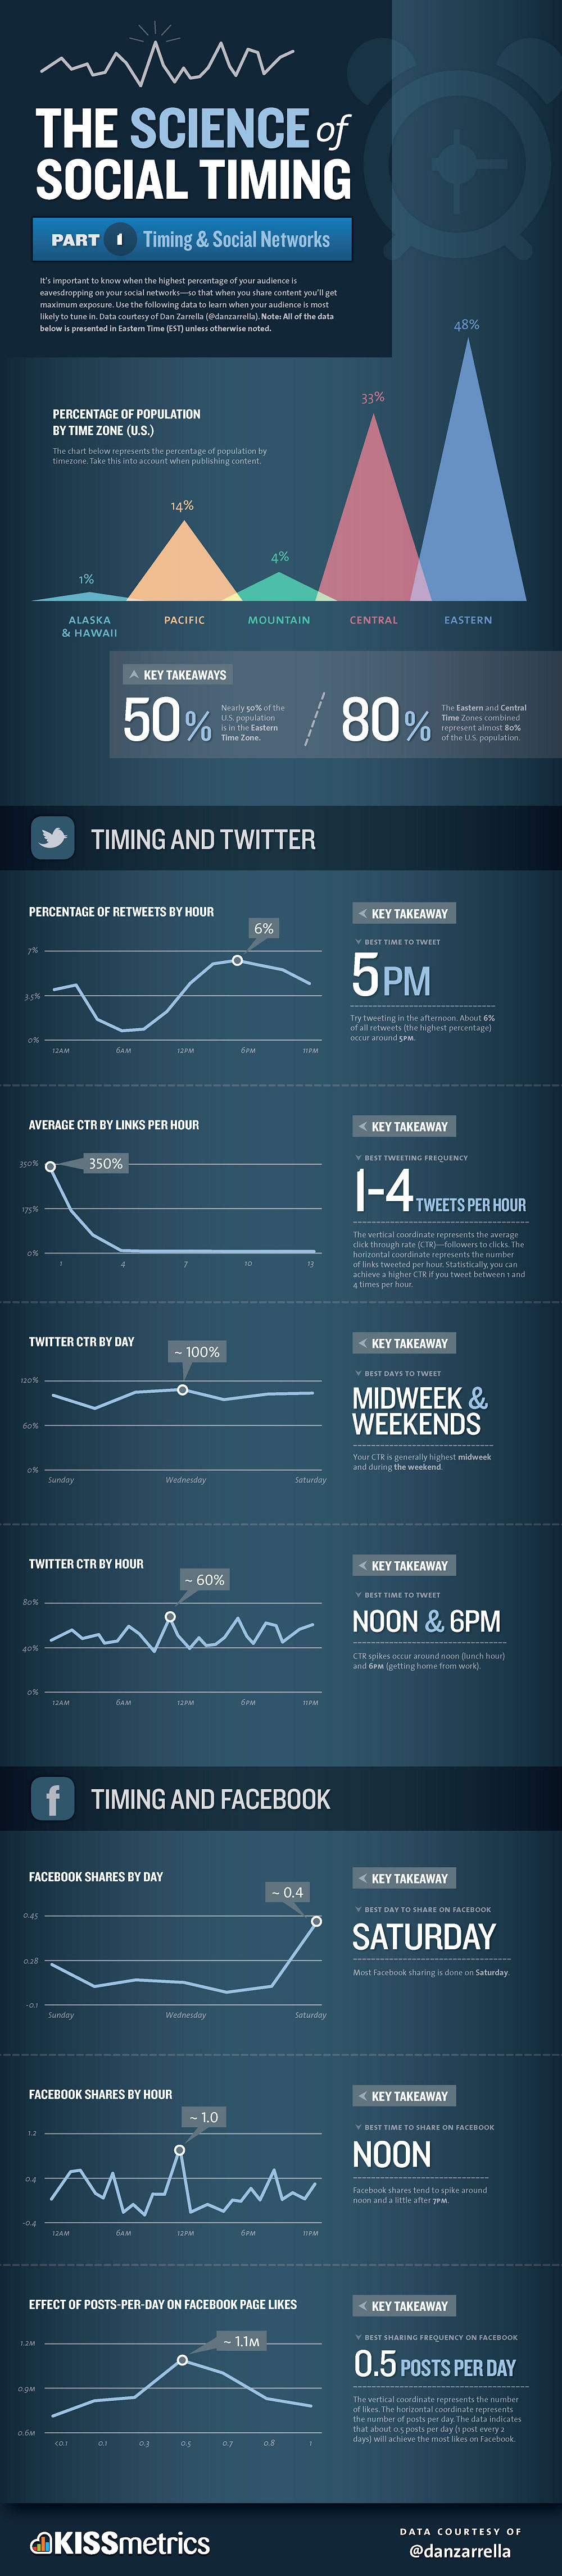
Infographic courtesy of Kiss Metrics.

Filed Under: Infographics

Primary Sidebar

E-mail Newsletter

  • Facebook
  • Twitter

More to See

Thinking Social Media Quotes

14 Thought Provoking Social Media Quotes and Resources

By Matt Fields

5 Tips to Get More Retweets on Twitter

By Matt Fields

Footer

Categories

  • Analysis
  • How To
  • Infographics
  • Interviews
  • Lifestyle
  • Miscellaneous
  • News
  • Platforms
  • Videos

Recent

  • Wishpond’s State of Content Marketing in 2013
  • Business Blogging 101: Getting Started to Blogging Success
  • Google’s Tap or Scan
  • Social Media’s Impact on Youth
  • Heineken’s Departure Roulette Campaign

Search

Copyright © 2025